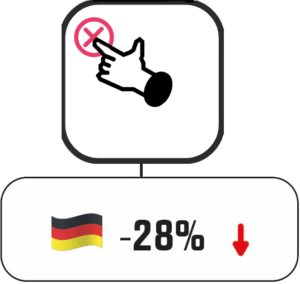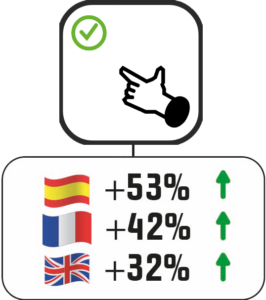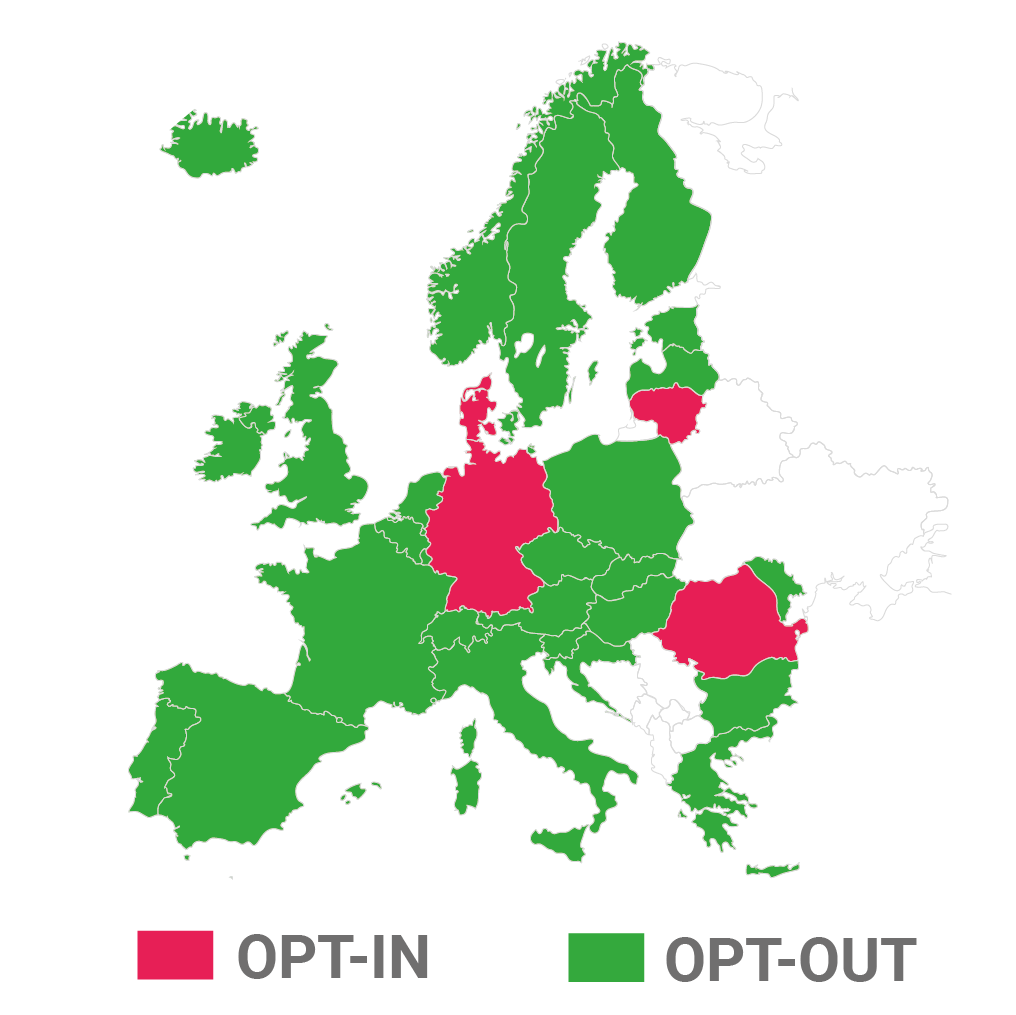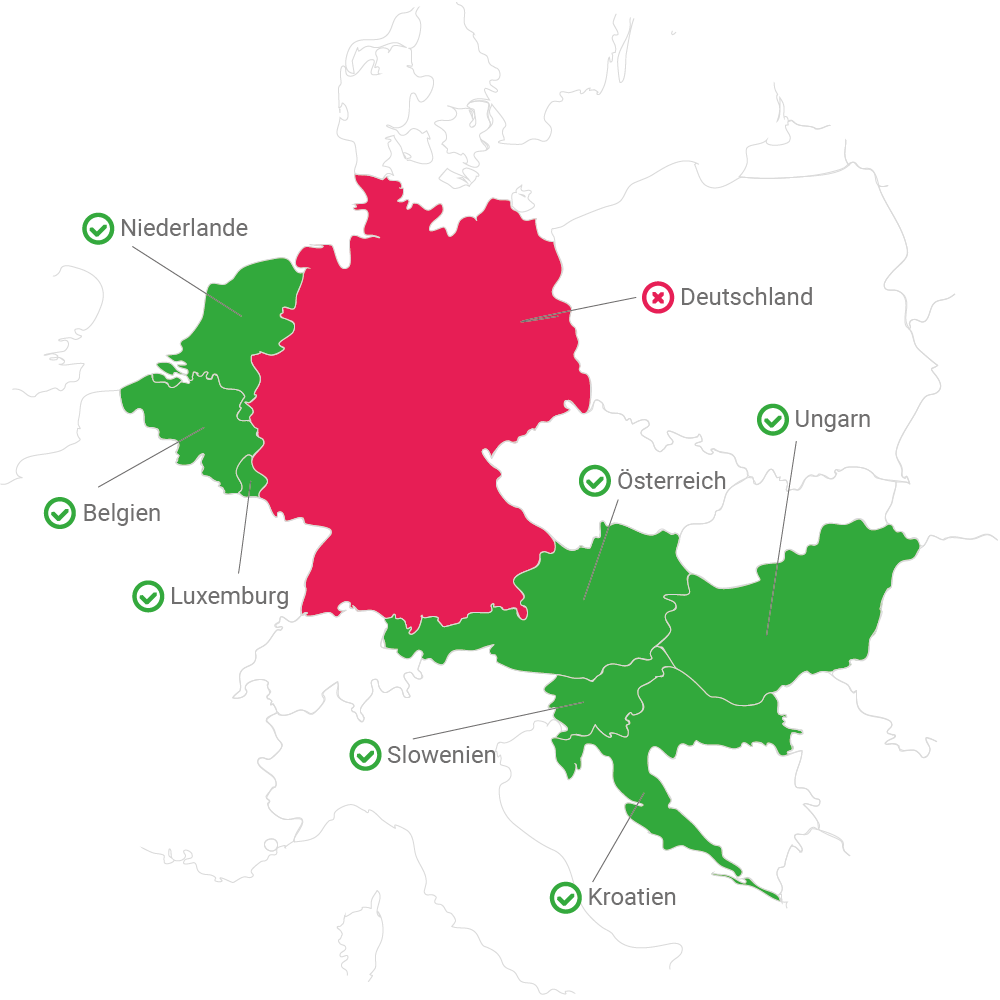
Statistics and graphics on organ donation numbers in Germany and other European countries.
The steady decline in organ donation in Germany has continued since 2010, while other European countries have had steady increases. This also has to do with the transplantation laws in force there with the “opt-out” (OPT-OUT) regulation, as can be seen in the graphics and statistics below.